---
title: "AI Ethics and Responsible AI"
---

```{python}
#| label: python-setup-58-ethics
#| include: false

import numpy as np
import pandas as pd
import matplotlib.pyplot as plt
import warnings
warnings.filterwarnings('ignore')
```

::: {.callout-note icon="false"}
## 📋 Learning Objectives

- Identify the primary ethical risks in AI-powered analytics: bias, fairness, privacy, and accountability
- Apply quantitative fairness metrics to evaluate disparate impact across demographic groups
- Understand explainability requirements and how to communicate model decisions to non-technical stakeholders
- Navigate the emerging regulatory landscape, including the EU AI Act and African data protection frameworks
- Implement responsible AI governance practices in your organisation
:::

## Why Ethics Matters in Analytics

The techniques in this book are powerful. A credit-scoring model trained on historical data can process thousands of loan applications per day at far lower cost than a team of human analysts. A churn-prediction model can identify at-risk customers before any human reviewer notices a pattern. A fraud-detection system can flag suspicious transactions in milliseconds.

But power without accountability is dangerous. Historical data encodes historical inequities. A credit model trained on data from a society where women were systematically excluded from formal employment will, if not carefully examined, learn to penalise women. An automated hiring system trained on decades of resumes from a male-dominated industry will, if not corrected, discriminate against women — even if gender is not an explicit input.

**This is not a hypothetical risk.** Multiple real-world AI systems have caused documented harm:

- Amazon scrapped its AI hiring tool in 2018 after discovering it penalised resumes containing the word "women's" (as in "women's chess club")
- Compas, a US criminal recidivism prediction tool, was found to score Black defendants as higher risk than white defendants with similar profiles
- In healthcare, an algorithm used by hundreds of US hospitals was found to recommend less care for Black patients with identical illness severity to white patients

These are not failures of mathematics. They are failures of oversight, governance, and ethical reasoning. As analytics professionals, you have both the technical capability and the professional responsibility to prevent such outcomes.

## Core Concepts in AI Ethics

### Bias: Sources and Types

Bias in AI systems arises from multiple sources:

| Bias Type | Definition | Example |
|:----------|:-----------|:--------|
| **Historical bias** | Training data reflects past discrimination | Loan data where minorities were denied credit |
| **Representation bias** | Some groups are underrepresented in training data | Medical AI trained mostly on Western patients |
| **Measurement bias** | Proxy variables indirectly encode protected attributes | Postcode as a proxy for race |
| **Aggregation bias** | One model applied to groups with different distributions | Diabetes risk model ignoring gender differences |
| **Deployment bias** | Model is used in a context different from training | Model trained on urban data deployed rurally |
| **Feedback loop bias** | Model predictions influence future training data | Predictive policing that over-scrutinises certain areas |

### Fairness: Multiple Definitions

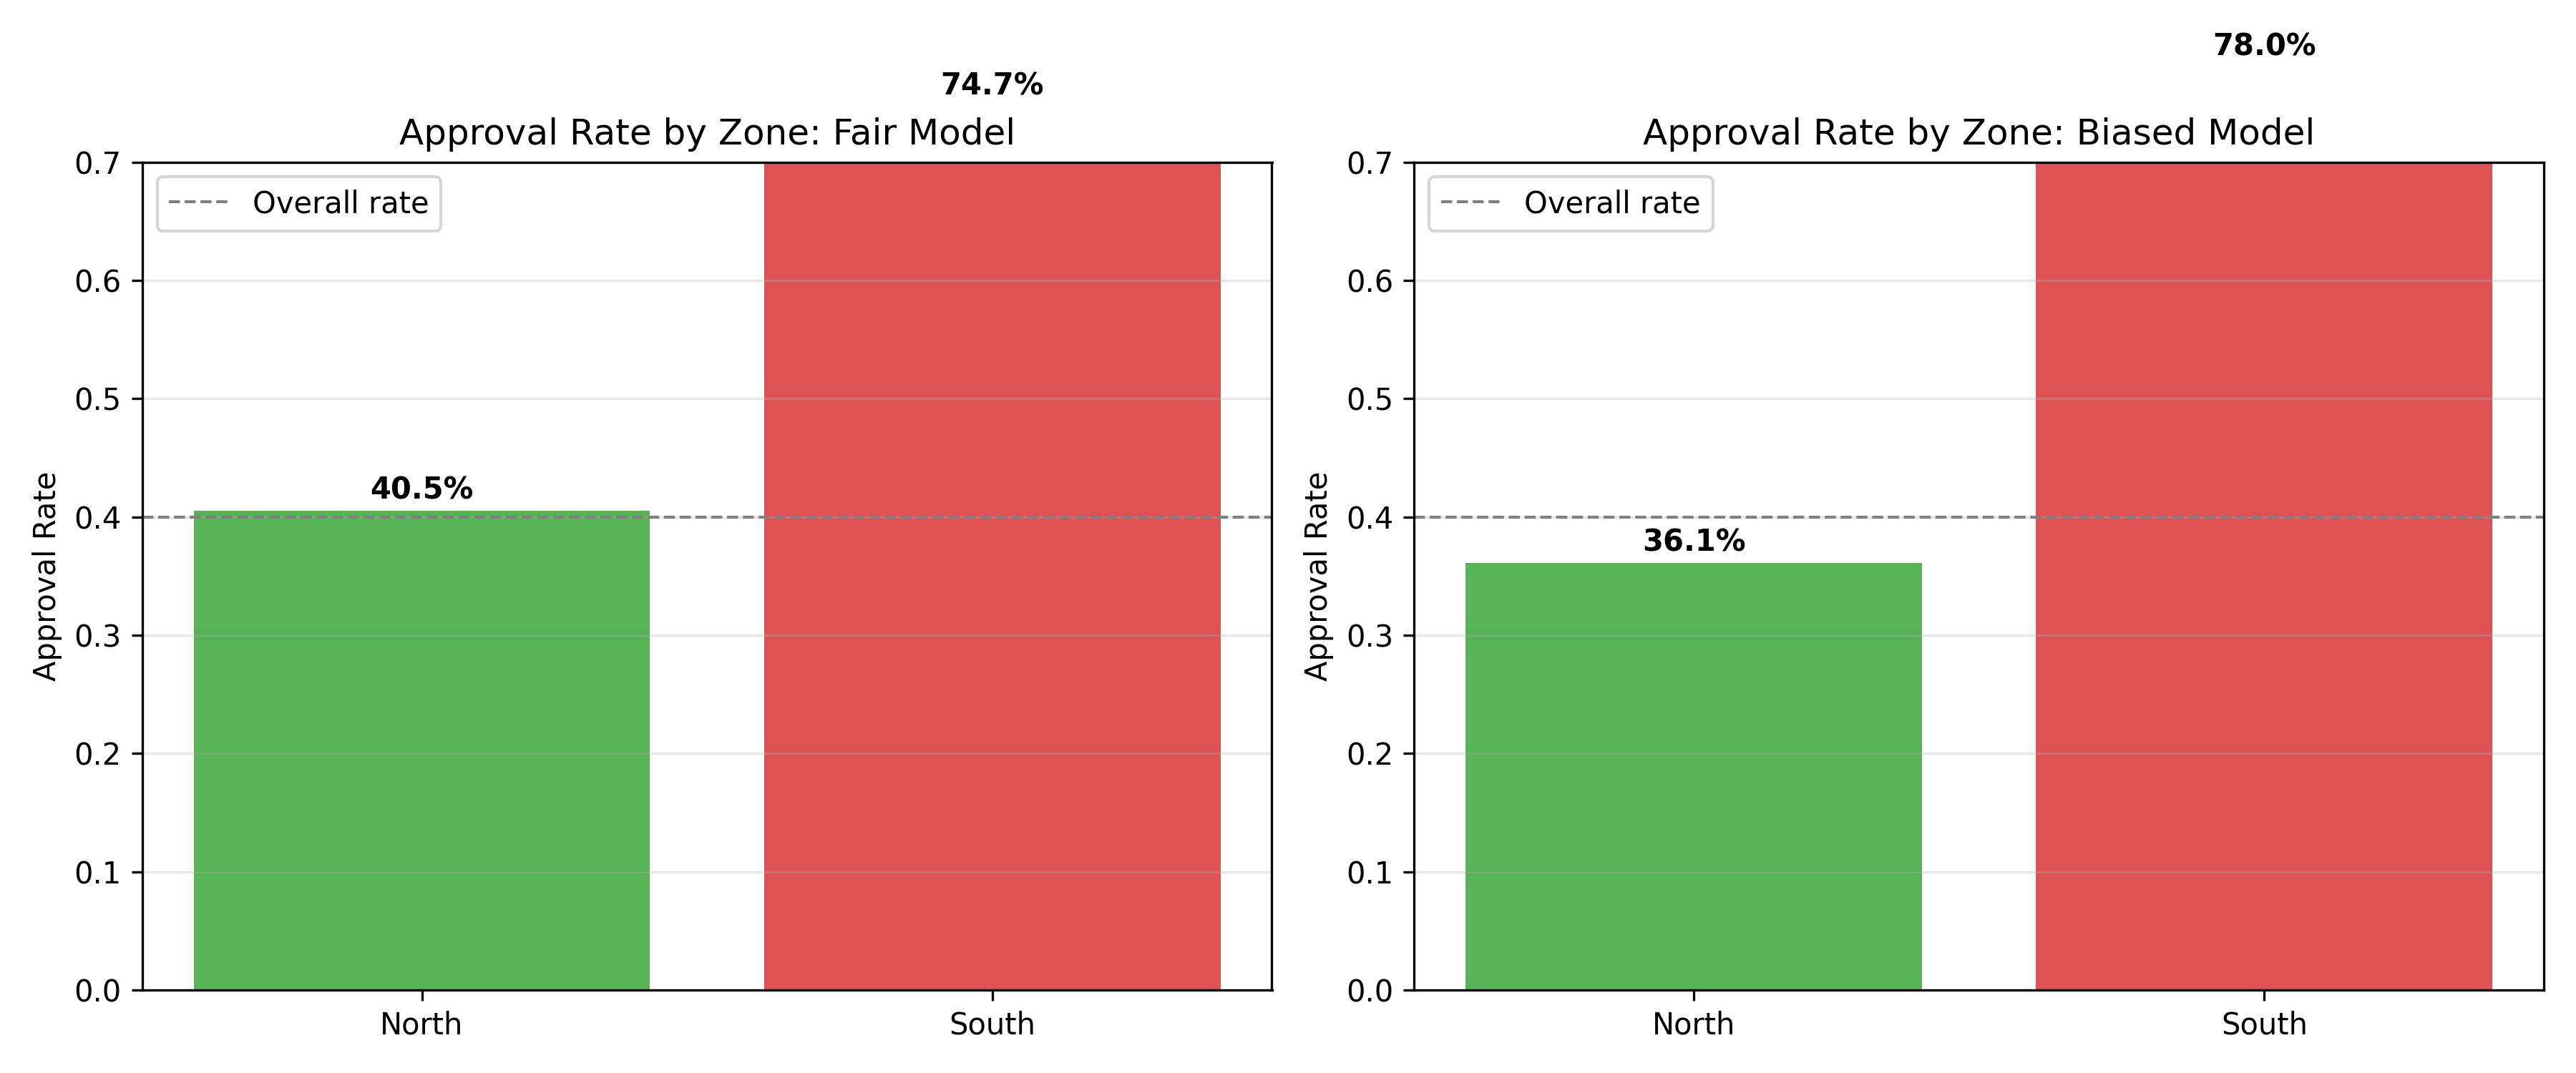
There is no single definition of "fairness." Different stakeholders may prefer different criteria, and — critically — it is mathematically impossible to satisfy all of them simultaneously.

::: {.callout-note icon="false"}
## 📘 Theory: Fairness Metrics

Let $\hat{Y}$ be the model's prediction, $Y$ be the true label, and $A \in \{0, 1\}$ be a sensitive attribute (e.g., gender, ethnicity).

**Demographic Parity:**
$P(\hat{Y} = 1 \mid A = 0) = P(\hat{Y} = 1 \mid A = 1)$
Equal approval (or positive prediction) rates across groups.

**Equal Opportunity:**
$P(\hat{Y} = 1 \mid Y = 1, A = 0) = P(\hat{Y} = 1 \mid Y = 1, A = 1)$
Equal true positive rates — qualified candidates from both groups are equally likely to be approved.

**Predictive Parity:**
$P(Y = 1 \mid \hat{Y} = 1, A = 0) = P(Y = 1 \mid \hat{Y} = 1, A = 1)$
Equal precision — a positive prediction means the same thing regardless of group.

**Individual Fairness:**
Similar individuals should receive similar predictions:
$\|\hat{Y}(x_i) - \hat{Y}(x_j)\| \leq L \cdot d(x_i, x_j)$

**The impossibility theorem (Chouldechova, 2017):** When base rates differ between groups, demographic parity, equal opportunity, and predictive parity cannot all be satisfied simultaneously.
:::

::: {.panel-tabset}
## R

```{r}
#| label: ch58-fairness-metrics-r
#| eval: true

library(tidyverse)

set.seed(5193)

# Simulate a loan approval dataset with demographic disparities
n <- 2000

loan_data <- tibble(
  applicant_id = 1:n,
  # Protected attribute: zone (North/South as a rough proxy)
  zone         = sample(c("North", "South"), n, replace = TRUE, prob = c(0.45, 0.55)),
  # Credit-relevant features
  credit_score = rnorm(n, mean = if_else(zone == "South", 620, 590), sd = 80),
  income_k     = rnorm(n, mean = if_else(zone == "South", 180, 150), sd = 60),
  years_employed = rnorm(n, mean = if_else(zone == "South", 6, 4), sd = 3)
) |>
  mutate(
    credit_score    = pmax(300, pmin(850, credit_score)),
    income_k        = pmax(50, income_k),
    years_employed  = pmax(0, years_employed),
    # True default probability (depends on credit features, NOT zone)
    default_prob    = plogis(-2 + 0.015 * (credit_score - 600) +
                             0.003 * income_k + 0.05 * years_employed),
    actual_default  = rbinom(n, 1, default_prob),
    # Model 1: Fair (uses only credit features)
    score_fair      = credit_score * 0.5 + income_k * 0.3 + years_employed * 20,
    approved_fair   = as.integer(score_fair > quantile(score_fair, 0.40)),
    # Model 2: Biased (implicitly disadvantages North via correlated feature)
    score_biased    = score_fair - if_else(zone == "North", rnorm(n, 15, 5), 0),
    approved_biased = as.integer(score_biased > quantile(score_biased, 0.40))
  )

# ── Compute fairness metrics ────────────────────────────────────────────────────
compute_fairness <- function(data, approved_col) {
  data |>
    group_by(zone) |>
    summarise(
      n                  = n(),
      approval_rate      = mean(.data[[approved_col]]),
      true_positive_rate = sum(.data[[approved_col]] == 1 & actual_default == 0) /
                           sum(actual_default == 0),
      false_positive_rate = sum(.data[[approved_col]] == 1 & actual_default == 1) /
                            sum(actual_default == 1),
      .groups = "drop"
    ) |>
    mutate(
      dem_parity_ratio = approval_rate / approval_rate[1]
    )
}

cat("=== Model 1: Fair (Credit Features Only) ===\n")
fair_metrics <- compute_fairness(loan_data, "approved_fair")
print(fair_metrics |> mutate(across(where(is.numeric), round, 3)))

cat("\n=== Model 2: Biased (Implicit Zone Penalty) ===\n")
biased_metrics <- compute_fairness(loan_data, "approved_biased")
print(biased_metrics |> mutate(across(where(is.numeric), round, 3)))

cat("\n=== Disparate Impact Analysis ===\n")
cat("Fair model — North/South approval ratio:",
    round(fair_metrics$approval_rate[1] / fair_metrics$approval_rate[2], 3), "\n")
cat("Biased model — North/South approval ratio:",
    round(biased_metrics$approval_rate[1] / biased_metrics$approval_rate[2], 3), "\n")
cat("\n80% rule (US EEOC guideline): ratio < 0.8 suggests disparate impact.\n")
```

## Python

```{python}
#| label: py-ch58-fairness-metrics
#| eval: true

import pandas as pd
import numpy as np
import matplotlib.pyplot as plt
from scipy.special import expit

np.random.seed(5193)
n = 2000

zone = np.random.choice(['North', 'South'], n, p=[0.45, 0.55])
credit_score = np.where(zone == 'South',
                        np.random.normal(620, 80, n),
                        np.random.normal(590, 80, n)).clip(300, 850)
income_k = np.where(zone == 'South',
                    np.random.normal(180, 60, n),
                    np.random.normal(150, 60, n)).clip(50)
years_emp = np.where(zone == 'South',
                     np.random.normal(6, 3, n),
                     np.random.normal(4, 3, n)).clip(0)

default_prob = expit(-2 + 0.015*(credit_score - 600) + 0.003*income_k + 0.05*years_emp)
actual_default = np.random.binomial(1, default_prob)

score_fair = credit_score * 0.5 + income_k * 0.3 + years_emp * 20
approved_fair = (score_fair > np.percentile(score_fair, 40)).astype(int)

score_biased = score_fair - np.where(zone == 'North', np.random.normal(15, 5, n), 0)
approved_biased = (score_biased > np.percentile(score_biased, 40)).astype(int)

data = pd.DataFrame({
    'zone': zone, 'credit_score': credit_score,
    'actual_default': actual_default,
    'approved_fair': approved_fair, 'approved_biased': approved_biased
})

def fairness_report(df, col):
    res = df.groupby('zone').apply(lambda g: pd.Series({
        'n': len(g),
        'approval_rate': g[col].mean(),
        'tpr': ((g[col]==1) & (g['actual_default']==0)).sum() / (g['actual_default']==0).sum(),
        'fpr': ((g[col]==1) & (g['actual_default']==1)).sum() / (g['actual_default']==1).sum(),
    })).reset_index()
    res['disparate_impact'] = res['approval_rate'] / res['approval_rate'].max()
    return res.round(3)

print("=== Fair Model ===")
print(fairness_report(data, 'approved_fair').to_string(index=False))

print("\n=== Biased Model ===")
print(fairness_report(data, 'approved_biased').to_string(index=False))

# Visualise
fig, (ax1, ax2) = plt.subplots(1, 2, figsize=(12, 5))
for ax, col, title in [(ax1, 'approved_fair', 'Fair Model'),
                        (ax2, 'approved_biased', 'Biased Model')]:
    rates = data.groupby('zone')[col].mean()
    bars = ax.bar(rates.index, rates.values, color=['#2ca02c', '#d62728'], alpha=0.8)
    ax.axhline(0.40, color='grey', linestyle='--', linewidth=1, label='Overall rate')
    ax.set_ylabel('Approval Rate')
    ax.set_title(f'Approval Rate by Zone: {title}')
    ax.set_ylim(0, 0.7)
    ax.legend()
    ax.grid(axis='y', alpha=0.3)
    for bar, rate in zip(bars, rates.values):
        ax.text(bar.get_x() + bar.get_width()/2, bar.get_height() + 0.01,
                f'{rate:.1%}', ha='center', fontweight='bold')

plt.tight_layout()
plt.savefig('ch58_fairness_comparison.png', dpi=150, bbox_inches='tight')
plt.show()
```

:::

## Explainability and Transparency

Regulators, customers, and courts increasingly require that AI decisions be **explainable**. In Nigeria, the CBN requires that credit decisions be accompanied by reasons. The EU AI Act (2024) mandates transparency for high-risk AI systems. GDPR grants individuals the right to an explanation of automated decisions.

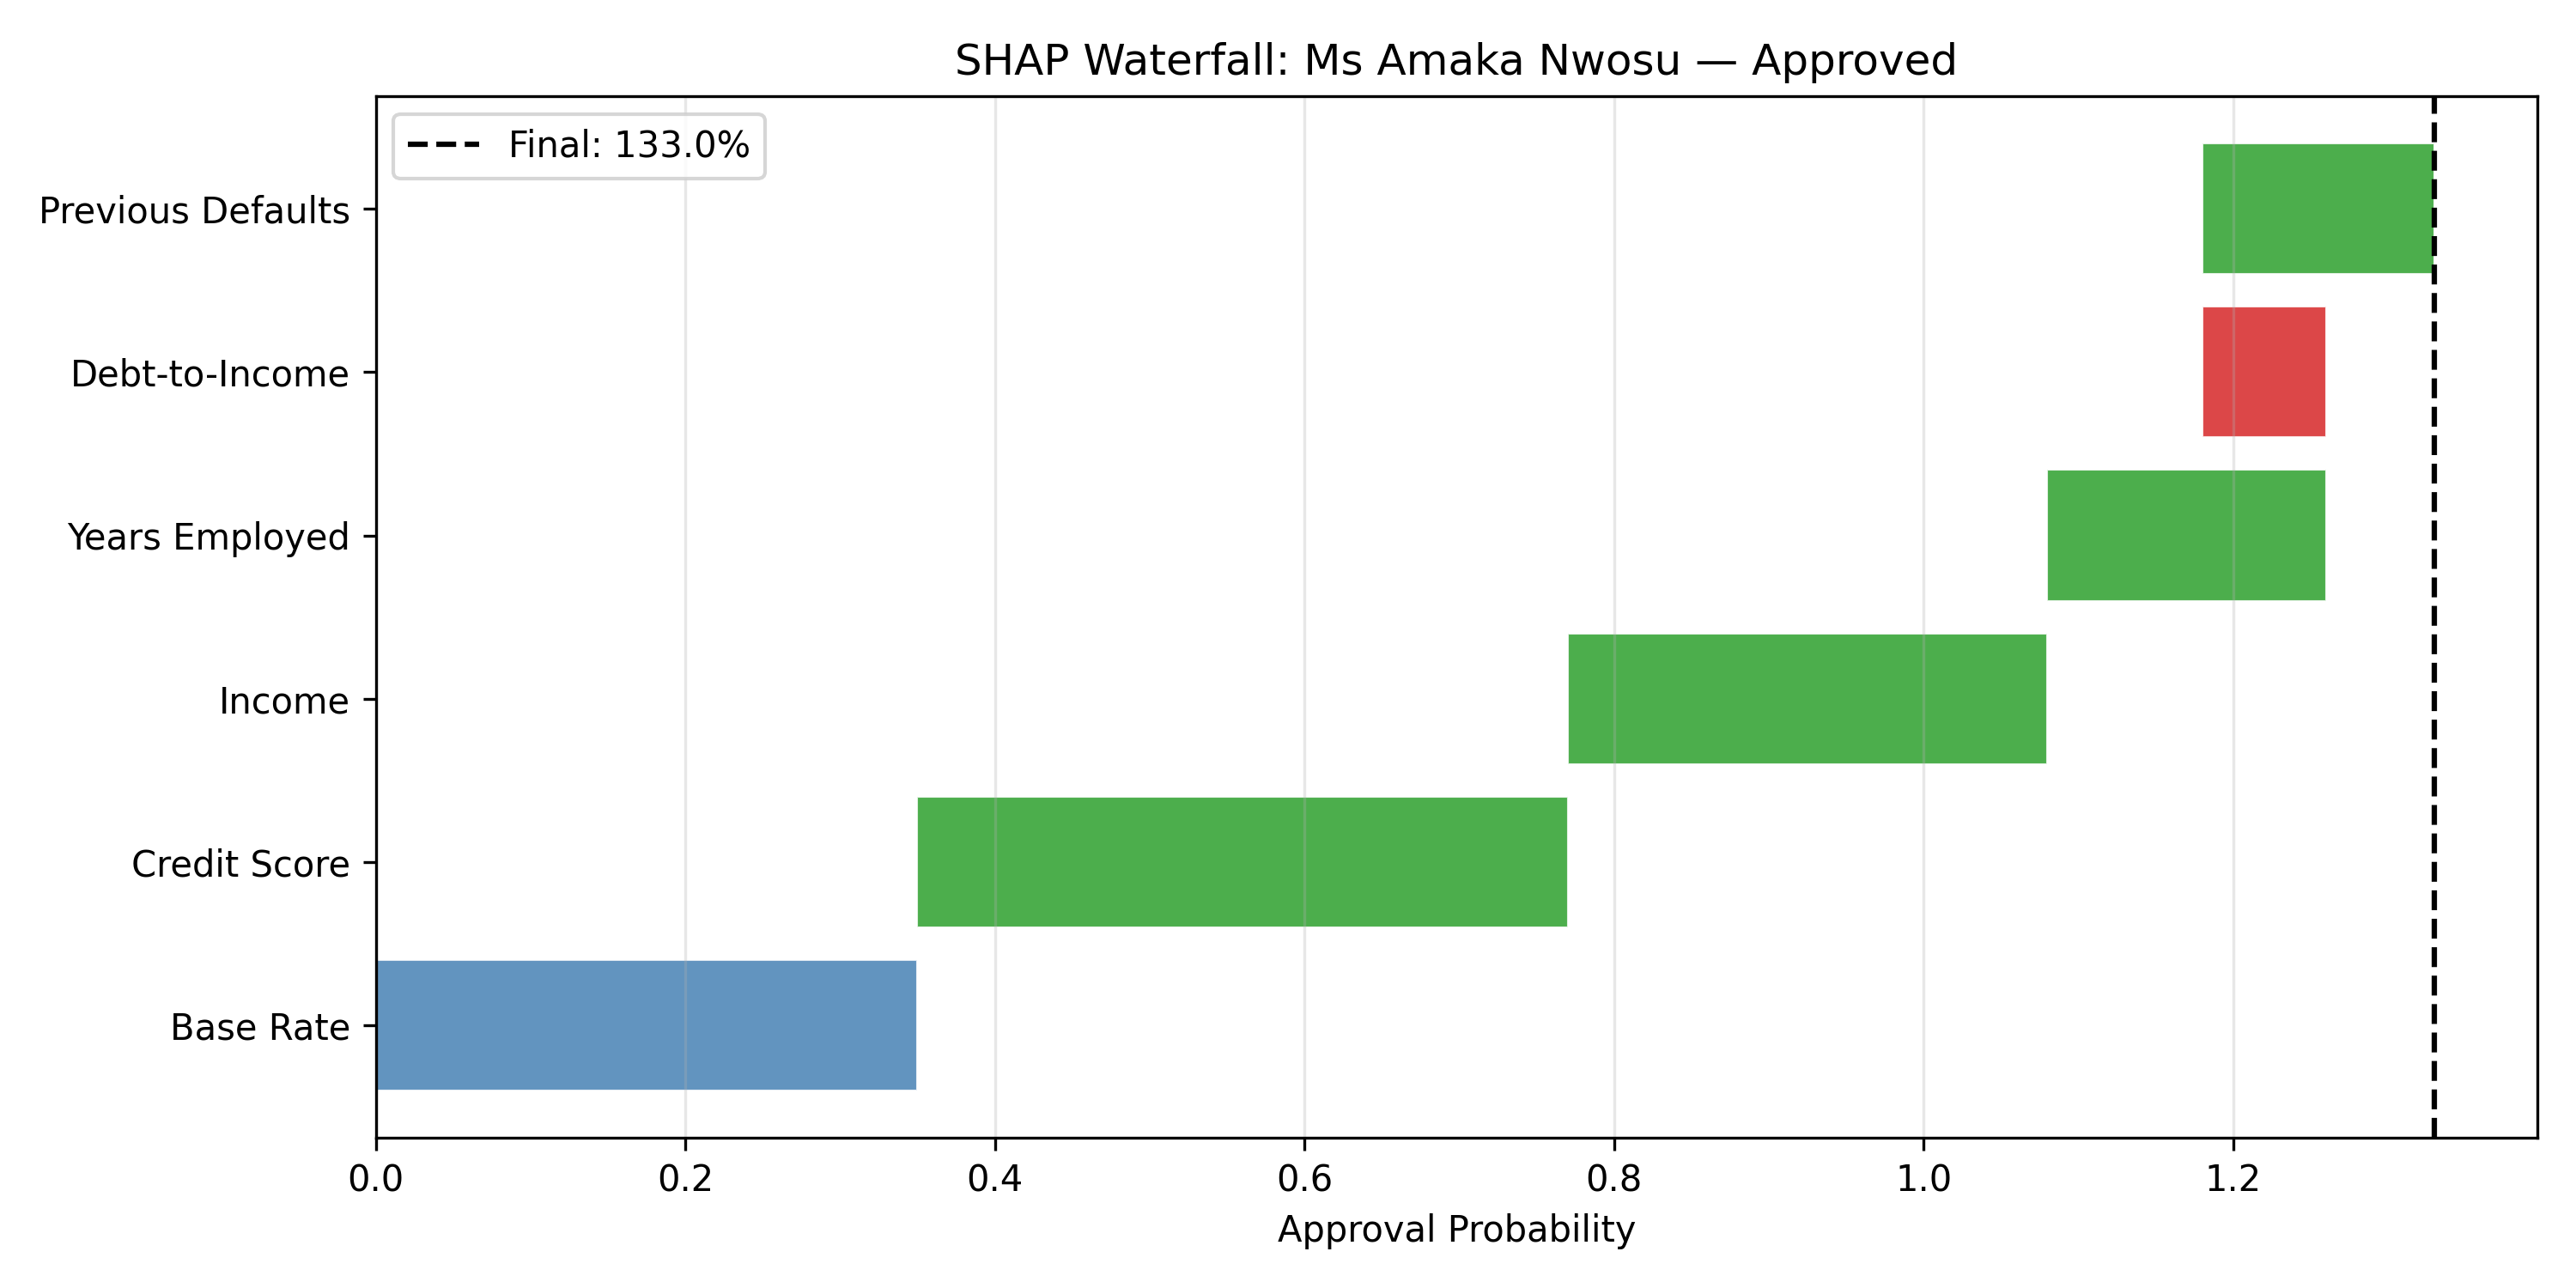
We covered SHAP and LIME in Chapter 16. Here we focus on how to communicate these explanations to non-technical stakeholders.

::: {.panel-tabset}
## R

```{r}
#| label: ch58-explainability-r
#| eval: true

library(tidyverse)

# Construct a clear explanation letter from SHAP-like feature contributions
generate_explanation_letter <- function(applicant, contributions, decision) {
  declined_factors <- contributions |>
    filter(direction == "negative") |>
    arrange(abs_contribution) |>
    head(3)

  supporting_factors <- contributions |>
    filter(direction == "positive") |>
    arrange(desc(abs_contribution)) |>
    head(2)

  cat("─────────────────────────────────────────────────────\n")
  cat("LOAN APPLICATION DECISION NOTICE\n")
  cat("─────────────────────────────────────────────────────\n\n")
  cat("Dear ", applicant$name, ",\n\n", sep = "")
  cat("Thank you for your loan application of ₦", format(applicant$amount, big.mark = ","),
      ".\n\n", sep = "")

  if (decision == "Declined") {
    cat("After a thorough assessment, we are unable to approve your\n")
    cat("application at this time. The key factors in this decision were:\n\n")
    for (i in 1:nrow(declined_factors)) {
      cat("  •  ", declined_factors$factor[i], ": ",
          declined_factors$explanation[i], "\n", sep = "")
    }
  } else {
    cat("We are pleased to approve your application. Key strengths:\n\n")
    for (i in 1:nrow(supporting_factors)) {
      cat("  •  ", supporting_factors$factor[i], ": ",
          supporting_factors$explanation[i], "\n", sep = "")
    }
  }

  cat("\nYou have the right to request further information about this\n")
  cat("decision and to lodge a complaint with our Credit Review Unit.\n\n")
  cat("Yours sincerely,\nCredit Decisions Team\n")
  cat("─────────────────────────────────────────────────────\n")
}

# Example application
applicant <- list(name = "Mr Emeka Obi", amount = 2500000)

contributions <- tribble(
  ~factor,              ~abs_contribution, ~direction, ~explanation,
  "Credit Score",       0.35,             "negative", "Credit score of 520 is below our minimum threshold of 650",
  "Loan-to-Income",     0.28,             "negative", "Requested loan is 4.2× annual income (maximum: 3.5×)",
  "Employment Tenure",  0.18,             "negative", "Current employment of 8 months is below the 12-month requirement",
  "Repayment History",  0.12,             "positive", "No previous defaults on record",
  "Account Relationship", 0.07,           "positive", "Active account with the bank for 3+ years"
)

generate_explanation_letter(applicant, contributions, "Declined")
```

## Python

```{python}
#| label: py-ch58-explainability
#| eval: true

import pandas as pd
import numpy as np

# Simulate SHAP values for a credit decision
applicant = {
    'name': 'Ms Amaka Nwosu',
    'loan_amount': 1_500_000,
    'decision': 'Approved'
}

shap_values = pd.DataFrame({
    'feature': ['Credit Score', 'Income', 'Years Employed', 'Debt-to-Income', 'Previous Defaults'],
    'value': [710, 220_000, 7.5, 0.28, 0],
    'shap': [0.42, 0.31, 0.18, -0.08, 0.15],
    'baseline': [0.35, 0.35, 0.35, 0.35, 0.35]
})

shap_values['direction'] = shap_values['shap'].apply(lambda x: 'Positive' if x > 0 else 'Negative')
shap_values['cumulative'] = shap_values['baseline'] + shap_values['shap'].cumsum()

print("=== SHAP-Based Credit Decision Explanation ===\n")
print(f"Applicant: {applicant['name']}")
print(f"Loan Amount: ₦{applicant['loan_amount']:,.0f}")
print(f"Decision: {applicant['decision']}\n")

print("Feature Contributions:")
for _, row in shap_values.iterrows():
    arrow = "↑ +" if row['shap'] > 0 else "↓  "
    print(f"  {row['feature']:<22} value: {str(row['value']):<10} "
          f"SHAP: {arrow}{row['shap']:.3f}")

base_rate  = float(shap_values['baseline'].iloc[0])
final_prob = base_rate + float(shap_values['shap'].sum())
print(f"\nBase rate (average approval):  {base_rate:.1%}")
print(f"Final approval probability:    {final_prob:.1%}")
print(f"\nDecision: {applicant['decision']}")
print("\nRegulatory note: This explanation has been logged for audit purposes.")

# Waterfall chart
fig, ax = plt.subplots(figsize=(10, 5))
features = shap_values['feature'].tolist()
shapvals = shap_values['shap'].tolist()
base = shap_values['baseline'].iloc[0]

cumul = [base]
for s in shapvals:
    cumul.append(cumul[-1] + s)

colors = ['steelblue'] + ['#2ca02c' if s > 0 else '#d62728' for s in shapvals]
bars = ax.barh(['Base Rate'] + features,
               [base] + shapvals,
               left=[0] + cumul[:-1],
               color=colors, alpha=0.85, edgecolor='white', linewidth=0.5)

ax.axvline(cumul[-1], color='black', linestyle='--', linewidth=1.5, label=f'Final: {cumul[-1]:.1%}')
ax.set_xlabel('Approval Probability')
ax.set_title(f'SHAP Waterfall: {applicant["name"]} — {applicant["decision"]}')
ax.legend()
ax.grid(axis='x', alpha=0.3)
plt.tight_layout()
plt.savefig('ch58_shap_waterfall.png', dpi=150, bbox_inches='tight')
plt.show()
```

:::

## Privacy and Data Protection

### African Data Protection Landscape

| Country/Region | Framework | Key Provisions |
|:---------------|:----------|:---------------|
| **Nigeria** | Nigeria Data Protection Act (NDPA, 2023) | Data subject rights, consent, cross-border transfer restrictions |
| **South Africa** | POPIA (Protection of Personal Information Act, 2020) | 8 lawful processing conditions, Information Regulator |
| **Kenya** | Data Protection Act (2019) | Registration of data controllers, impact assessments |
| **Ghana** | Data Protection Act (2012) | Data Protection Commission oversight |
| **ECOWAS** | Supplementary Act on Personal Data (2010) | Framework for the region |
| **EU (GDPR)** | General Data Protection Regulation (2018) | Applies to any organisation processing EU residents' data |

### Privacy-Preserving Analytics Techniques

::: {.panel-tabset}
## R

```{r}
#| label: ch58-privacy-r
#| eval: true

library(tidyverse)

set.seed(8834)

# ── Technique 1: Data Anonymisation via k-Anonymity ──────────────────────────
# A dataset is k-anonymous if every record is indistinguishable from
# at least k-1 others on the quasi-identifiers.

raw_data <- tibble(
  name         = c("Aisha Bello", "Chukwu Eze", "Fatima Umar", "James Ade",
                    "Ngozi Obi", "Sani Danladi"),
  age          = c(28, 35, 28, 42, 35, 42),
  postcode     = c("100001", "100001", "100001", "102001", "102001", "102001"),
  salary_k     = c(180, 220, 175, 350, 210, 380),
  has_diabetes = c(0, 1, 0, 1, 0, 1)
)

# Generalise quasi-identifiers to achieve 3-anonymity
anonymised <- raw_data |>
  mutate(
    name     = "REDACTED",                                    # Direct identifier removed
    age_band = cut(age, breaks = c(20, 35, 50),              # Age generalised
                   labels = c("20–35", "35–50")),
    postcode_trunc = str_sub(postcode, 1, 4) |> paste0("XX")  # Postcode truncated to 4 digits
  ) |>
  select(-name, -age, -postcode)

cat("=== Original Data (Privacy Risk) ===\n")
print(raw_data |> select(-name))

cat("\n=== 3-Anonymised Data (k=3 per quasi-identifier combination) ===\n")
print(anonymised)

cat("\nVerification: Each (age_band, postcode) group has k =",
    min(anonymised |> count(age_band, postcode_trunc) |> pull(n)), "records.\n")

# ── Technique 2: Differential Privacy (noise addition) ─────────────────────────
cat("\n=== Differential Privacy Example ===\n")

true_avg_salary  <- mean(raw_data$salary_k)
epsilon          <- 1.0      # Privacy budget (smaller = more private)
sensitivity      <- 330      # Max salary range / n
noise            <- rlaplace <- function(n, mu, b) mu + (rexp(n, 1/b) - rexp(n, 1/b))

dp_avg_salary <- true_avg_salary + noise(1, 0, sensitivity / epsilon)

cat("True average salary:              ₦", round(true_avg_salary, 0), "k\n")
cat("DP-noised average salary:         ₦", round(dp_avg_salary, 0), "k\n")
cat("Privacy budget (epsilon):         ", epsilon, "\n")
cat("The noised value protects individuals while preserving the aggregate signal.\n")
```

## Python

```{python}
#| label: py-ch58-privacy
#| eval: true

import pandas as pd
import numpy as np

np.random.seed(8834)

# Demonstrate k-anonymity and differential privacy

raw = pd.DataFrame({
    'name': ['Aisha Bello', 'Chukwu Eze', 'Fatima Umar', 'James Ade', 'Ngozi Obi', 'Sani Danladi'],
    'age': [28, 35, 28, 42, 35, 42],
    'postcode': ['100001', '100001', '100001', '102001', '102001', '102001'],
    'salary_k': [180, 220, 175, 350, 210, 380],
    'has_diabetes': [0, 1, 0, 1, 0, 1]
})

print("=== Original Data ===")
print(raw.drop(columns=['name']).to_string(index=False))

# k-Anonymisation
anon = raw.copy()
anon['name'] = 'REDACTED'
anon['age_band'] = pd.cut(anon['age'], bins=[20, 35, 50], labels=['20-35', '35-50'])
anon['postcode_trunc'] = anon['postcode'].str[:4] + 'XX'
anon = anon.drop(columns=['name', 'age', 'postcode'])

print("\n=== 3-Anonymised Data ===")
print(anon.to_string(index=False))

k = anon.groupby(['age_band', 'postcode_trunc']).size().min()
print(f"\nMinimum k achieved: {k} (all quasi-identifier groups have at least {k} records)")

# Differential Privacy
print("\n=== Differential Privacy: Salary Average ===")
true_mean = raw['salary_k'].mean()
sensitivity = 330  # (max - min) salary range
epsilon = 1.0

laplace_noise = np.random.laplace(0, sensitivity / epsilon)
dp_mean = true_mean + laplace_noise

print(f"True mean salary:   ₦{true_mean:.0f}k")
print(f"DP noised mean:     ₦{dp_mean:.0f}k")
print(f"Privacy budget ε:   {epsilon}  (lower = stronger privacy)")
print("The noise hides individual values while preserving population statistics.")
```

:::

## Accountability and Governance

Responsible AI is not just a technical problem — it is an organisational one. The following governance framework applies whether you are building a model in a startup, a multinational, or a government agency.

```{r}
#| label: ch58-governance-r
#| eval: true
#| code-fold: false

library(tidyverse)

governance_checklist <- tribble(
  ~Phase, ~Practice, ~Tool_or_Output,
  "Design",     "Define the problem and success criteria explicitly",         "Problem statement doc",
  "Design",     "Identify affected stakeholders and potential harms",         "Stakeholder impact map",
  "Design",     "Check data sources for historical bias",                     "Data provenance audit",
  "Development","Evaluate model on fairness metrics across demographic groups","Fairness audit report",
  "Development","Document model assumptions and limitations",                 "Model card",
  "Development","Implement explainability (SHAP, LIME) for high-stakes models","Explanation framework",
  "Deployment", "Establish human review thresholds for borderline decisions", "Escalation protocol",
  "Deployment", "Monitor for distribution shift and performance degradation",  "Model monitoring dashboard",
  "Deployment", "Log all model decisions for audit",                          "Decision audit trail",
  "Lifecycle",  "Set model expiration dates and retraining triggers",         "Model refresh schedule",
  "Lifecycle",  "Provide appeals process for automated decisions",            "Complaints procedure",
  "Lifecycle",  "Annual ethics review by independent panel",                  "Ethics review report"
)

cat("=== Responsible AI Governance Checklist ===\n\n")
for (phase in unique(governance_checklist$Phase)) {
  cat("▶", phase, "\n")
  items <- governance_checklist |> filter(Phase == phase)
  for (i in 1:nrow(items)) {
    cat("  □ ", items$Practice[i], "\n", sep = "")
    cat("      → ", items$Tool_or_Output[i], "\n", sep = "")
  }
  cat("\n")
}
```

## The Regulatory Landscape

### EU AI Act (2024)

The EU AI Act classifies AI systems by risk level:

| Risk Level | Examples | Requirements |
|:-----------|:---------|:-------------|
| **Unacceptable** | Social scoring, real-time biometric surveillance in public | **Prohibited** |
| **High** | Credit scoring, hiring, CV screening, essential services | Transparency, human oversight, conformity assessment, registration |
| **Limited** | Chatbots, deepfakes | Disclosure requirements |
| **Minimal** | Spam filters, AI in video games | No specific requirements |

For Nigerian and African organisations that export to the EU, or process data of EU residents, high-risk provisions effectively apply.

### Nigeria: NDPA 2023 and CBN AI Guidelines

The Nigeria Data Protection Act (2023) gives individuals the right to:
- Know what data is collected about them
- Access, correct, and delete their data
- Opt out of automated decision-making with legal effects

The Central Bank of Nigeria (CBN) has issued guidance requiring banks to:
- Document AI models used in credit decisions
- Provide reasons for declined applications
- Maintain audit logs for five years
- Report AI-related incidents to the CBN within 72 hours

::: {.callout-caution icon="false"}
## 📝 Chapter Review Questions

1. A credit-scoring model has an overall AUC of 0.82 but shows a disparate impact ratio of 0.68 for female applicants. What does this mean, and what are your options for addressing it?

2. Define the "impossibility theorem" of fairness in your own words. What practical implication does this have for a bank deploying an automated loan system?

3. Your organisation wants to share anonymised customer data with an academic research partner. What steps would you take to ensure the data cannot be re-identified?

4. A model's SHAP explanation shows that "postcode" is the most important feature in a credit risk model. Should this concern you? What would you investigate?

5. Under the Nigeria Data Protection Act, a customer disputes a loan decline made by an AI model. What must your organisation provide to the customer?
:::

## Chapter Exercises

::: {.exercises}

#### Chapter 58 Exercises

**Exercise 58.1: Identifying Bias in AI Systems**

(a) A bank's loan approval model was trained on 10 years of historical data during which women were statistically less likely to receive loans (due to discriminatory practices at the time). The model learns to predict "loan granted" based on historical outcomes. Explain, step by step, how this creates a **feedback loop** that perpetuates discrimination even if gender is not explicitly included as a feature.

(b) A hospital in Abuja deploys an AI system to predict which patients are at risk of developing complications after surgery. The system was trained mostly on data from European hospitals. A Nigerian doctor notices it performs well for middle-class urban patients but poorly for rural patients. What type of bias is this, and why does it occur?

(c) A company's AI-powered CV screening tool rejects candidates whose resumes mention "women's leadership" or "female entrepreneur networks." This was not intentional — the model learned from historical hiring decisions. Explain why removing the word "gender" from the input data would *not* solve this problem. What would actually solve it?

(d) **Measurement bias** occurs when the data used to train a model measures the wrong thing. A predictive policing algorithm uses "past arrests" as a proxy for "criminal behaviour." Explain why this proxy is flawed and how the flawed measurement introduces bias against communities that have historically been over-policed.

(e) You are auditing a credit scoring model for bias. You compare approval rates across three groups: Salaried employees (72%), Self-employed (48%), Unemployed (15%). Is this necessarily evidence of bias? What additional analysis would you need to determine whether these differences are legitimate or discriminatory?

---

**Exercise 58.2: Fairness Metrics — Calculations and Trade-offs**

A recruitment AI tool screens candidates for a management training programme. In a test on 1,000 candidates (500 male, 500 female), the tool produces these outcomes:

|  | Males Recommended | Males Not Recommended | Females Recommended | Females Not Recommended |
|--|---|---|---|---|
| Truly Qualified | 180 | 20 | 120 | 80 |
| Not Truly Qualified | 80 | 220 | 40 | 260 |

(a) Calculate the **overall recommendation rate** (% recommended) for males and females. Calculate the **disparate impact ratio** (female rate ÷ male rate).

(b) Calculate the **True Positive Rate (Recall / Equal Opportunity)** for each group: of all truly qualified candidates, what fraction were recommended? Is the model equally good at identifying qualified candidates from both groups?

(c) Calculate the **Precision** for each group: of those recommended, what fraction are truly qualified? Is a "pass" from the tool equally meaningful for both groups?

(d) You are told that the **base rate** (proportion of truly qualified candidates) differs: 40% of male candidates are truly qualified vs. 40% of female candidates. (Both groups have the same base rate in this dataset.) The model still shows disparate impact. What does this tell you about the source of the discrimination?

(e) The hiring manager says: "Fix it so that the same percentage of male and female candidates are recommended (demographic parity)." The data scientist says: "But if we do that, we'll need to lower the threshold for females, which means we'll recommend less-qualified female candidates." Explain the fundamental tension here, using the **impossibility theorem** as your framework.

---

**Exercise 58.3: Explainability in Practice**

A Nigerian telecoms company uses an AI model to predict whether a customer will file a regulatory complaint in the next 30 days. The model flags 500 high-risk customers each week for priority service.

(a) A customer calls to say: "I was told I'm on a 'high-risk' list and I want to know why." Under the Nigeria Data Protection Act (NDPA 2023), what rights does this customer have? What must the company provide?

(b) The model uses 47 features including: days since last call to customer service, average call waiting time, number of dropped calls, bill amount, subscription type. SHAP analysis shows the top 3 features for this specific customer are: dropped calls (+0.42), call waiting time (+0.31), and subscription type: prepaid (−0.18). Translate these three SHAP values into a plain-English explanation suitable for a customer service agent to read to the customer.

(c) The telecoms regulator (NCC) audits the company and asks: "Show us that your model does not discriminate based on geography (which, in Nigeria, correlates with ethnicity)." Describe the specific fairness analysis you would conduct to answer this question.

(d) The company's legal team says: "We should not tell customers *why* they are flagged — this could be used to game the system." The customer experience team says: "We must explain — the customer deserves to know." Who is right? How would you design a system that balances transparency with gaming-resistance?

(e) Propose a **model governance policy** of 5 rules for this telecoms company. Each rule should address a specific ethical risk and describe what the company must do (not just what it should avoid).

---

**Exercise 58.4: Data Privacy in Analytics**

A hospital network in Nigeria wants to use patient data to build predictive models for disease prevention. They have records for 2 million patients covering: demographics, diagnosis history, medication records, and appointment attendance.

(a) Under the Nigeria Data Protection Act 2023, what legal basis would the hospital need to process this data for research purposes? What must patients be told?

(b) The hospital wants to share the dataset with a university research team. Before sharing, they remove patient names and ID numbers. Explain why this **anonymisation** may be insufficient, and describe a specific re-identification attack that could use the remaining data.

(c) The research team proposes using **k-anonymity** to protect the dataset. Explain what k-anonymity means (without using technical jargon) and describe one weakness of k-anonymity that a more advanced technique like l-diversity addresses.

(d) A data scientist proposes training the model using **federated learning** — training on data that never leaves the hospital's servers. Explain how federated learning works and why it addresses the privacy concern better than sharing raw data.

(e) After the model is deployed, a journalist discovers it and writes a story: "Hospital AI predicts your risk of diabetes — without your consent." Assess the ethical issue raised and how the hospital should have handled the consent process from the start.

---

**Exercise 58.5: Capstone — Responsible AI Governance Policy**

You are the Chief Data Officer of a major Nigerian commercial bank. The Board has asked you to develop a **Responsible AI Policy** for the bank.

(a) The bank uses AI in five areas: credit scoring, fraud detection, customer service chatbots, employee performance evaluation, and marketing personalisation. Rank these five applications from highest to lowest ethical risk. Justify your ranking using specific harms that could occur in each application.

(b) For the highest-risk application (your #1 from above), design a **human-in-the-loop** protocol. Specifically: what decisions can the AI make autonomously, which require human review, and which must always be made by a qualified human?

(c) Draft a **Model Risk Assessment Checklist** with 8 specific items that the bank's data science team must complete before deploying any new AI model. For each item, write: (i) the question the team must answer; (ii) what evidence they must provide.

(d) The bank's Board asks: "How do we know our AI systems are behaving ethically on an ongoing basis?" Design a **quarterly AI Ethics Review** process: who attends, what is reviewed, what triggers an alert, and what actions can the Board take.

(e) Write a 300-word **Responsible AI Statement** for the bank's public website. This statement should: explain the bank's commitments to customers; name specific rights customers have regarding AI decisions; describe the bank's oversight process. Write in plain language that a non-technical customer can understand.

:::

## Further Reading

Barocas, S., Hardt, M., & Narayanan, A. (2023). *Fairness and Machine Learning: Limitations and Opportunities.* fairmlbook.org (open access).

Chouldechova, A. (2017). Fair prediction with disparate impact: A study of bias in recidivism prediction instruments. *Big Data*, 5(2), 153–163.

Dwork, C., & Roth, A. (2014). The Algorithmic Foundations of Differential Privacy. *Foundations and Trends in Theoretical Computer Science*, 9(3–4).

European Parliament. (2024). *Artificial Intelligence Act.* EUR-Lex.

Nigeria Data Protection Commission. (2023). *Nigeria Data Protection Act 2023.* ndpc.gov.ng.

---