---
title: "Conclusion: Building Your Analytics Practice"
number-sections: true
---
```{r}
#| label: conclusion-setup
#| include: false
library(tidyverse)
```
## You Have Come a Long Way
When you opened this book, you were a manager, analyst, or student interested in data. You may have been comfortable with spreadsheets, perhaps wary of code, and uncertain about where statistics ended and "AI" began.
You have now worked through:
- **Statistical foundations** — distributions, hypothesis tests, the logic of inference
- **Exploratory analysis** — profiling data, visualising distributions, spotting anomalies
- **Prediction** — regression, classification, ensemble methods, deep learning
- **Pattern discovery** — clustering, association rules, dimensionality reduction
- **Time series** — forecasting with ARIMA, Prophet, and modern neural methods
- **Text and language** — NLP, sentiment, topic modelling, and large language models
- **Specialised analytics** — financial risk, fraud detection, customer lifetime value, supply chain, people analytics, simulation
- **Emerging horizons** — generative AI and the ethical responsibilities that come with analytical power
That is an extraordinary range. You are now equipped to participate meaningfully in any analytics conversation in any industry.
## A Map of Methods
The table below summarises the core methods in this book and their primary applications. Use it as a reference when approaching new problems.
```{r}
#| label: methods-map
#| eval: true
library(tidyverse)
methods <- tribble(
~Category, ~Method, ~When_to_Use, ~Chapter,
"Exploration", "EDA (summary stats, distributions)", "Always — the first step on any new dataset", "4",
"Exploration", "Correlation analysis", "Quantify linear relationships between variables", "8",
"Visualisation", "ggplot2 / Plotly", "Any time you need to communicate data", "5",
"Testing", "t-test, ANOVA", "Compare means across 2 or more groups", "6",
"Testing", "A/B testing", "Evaluate interventions with random assignment", "7",
"Regression", "Linear regression", "Predict a continuous outcome; explain drivers", "9",
"Regression", "Ridge/Lasso", "Many features, prevent overfitting", "10",
"Classification", "Logistic regression", "Binary outcome; need interpretability (e.g. credit)", "13",
"Classification", "Decision trees", "Interpretable, non-linear patterns", "14",
"Classification", "Random Forest / XGBoost", "Best accuracy on structured data", "15",
"Explainability", "SHAP / LIME", "Explain any black-box model decision", "16",
"Clustering", "K-Means", "Segment customers or products into groups", "20",
"Clustering", "DBSCAN / Hierarchical", "Unknown number of clusters; outlier detection", "21",
"Dimensionality", "PCA / t-SNE / UMAP", "Visualise high-dimensional data; feature reduction", "22",
"Time Series", "ARIMA / SARIMA", "Forecast univariate series with seasonality", "24",
"Time Series", "Prophet", "Business forecasts with holidays and trend changes", "25",
"Text", "TF-IDF / topic models", "Summarise document corpora; classify text", "27,29",
"Text", "Sentiment analysis", "Score text as positive/negative/neutral", "28",
"Text", "LLMs / RAG", "Complex language tasks; knowledge Q&A", "57",
"Survival", "Kaplan-Meier / Cox regression", "Time-to-event: churn, default, failure", "41",
"Simulation", "Monte Carlo", "Quantify uncertainty in business decisions", "55",
"Simulation", "Bayesian inference", "Incorporate prior knowledge; update beliefs with data", "56",
"Ethics", "Fairness metrics / SHAP audits", "Any model that affects people's lives", "58"
)
print(methods, n = Inf)
```
## The Analytics Career Ladder
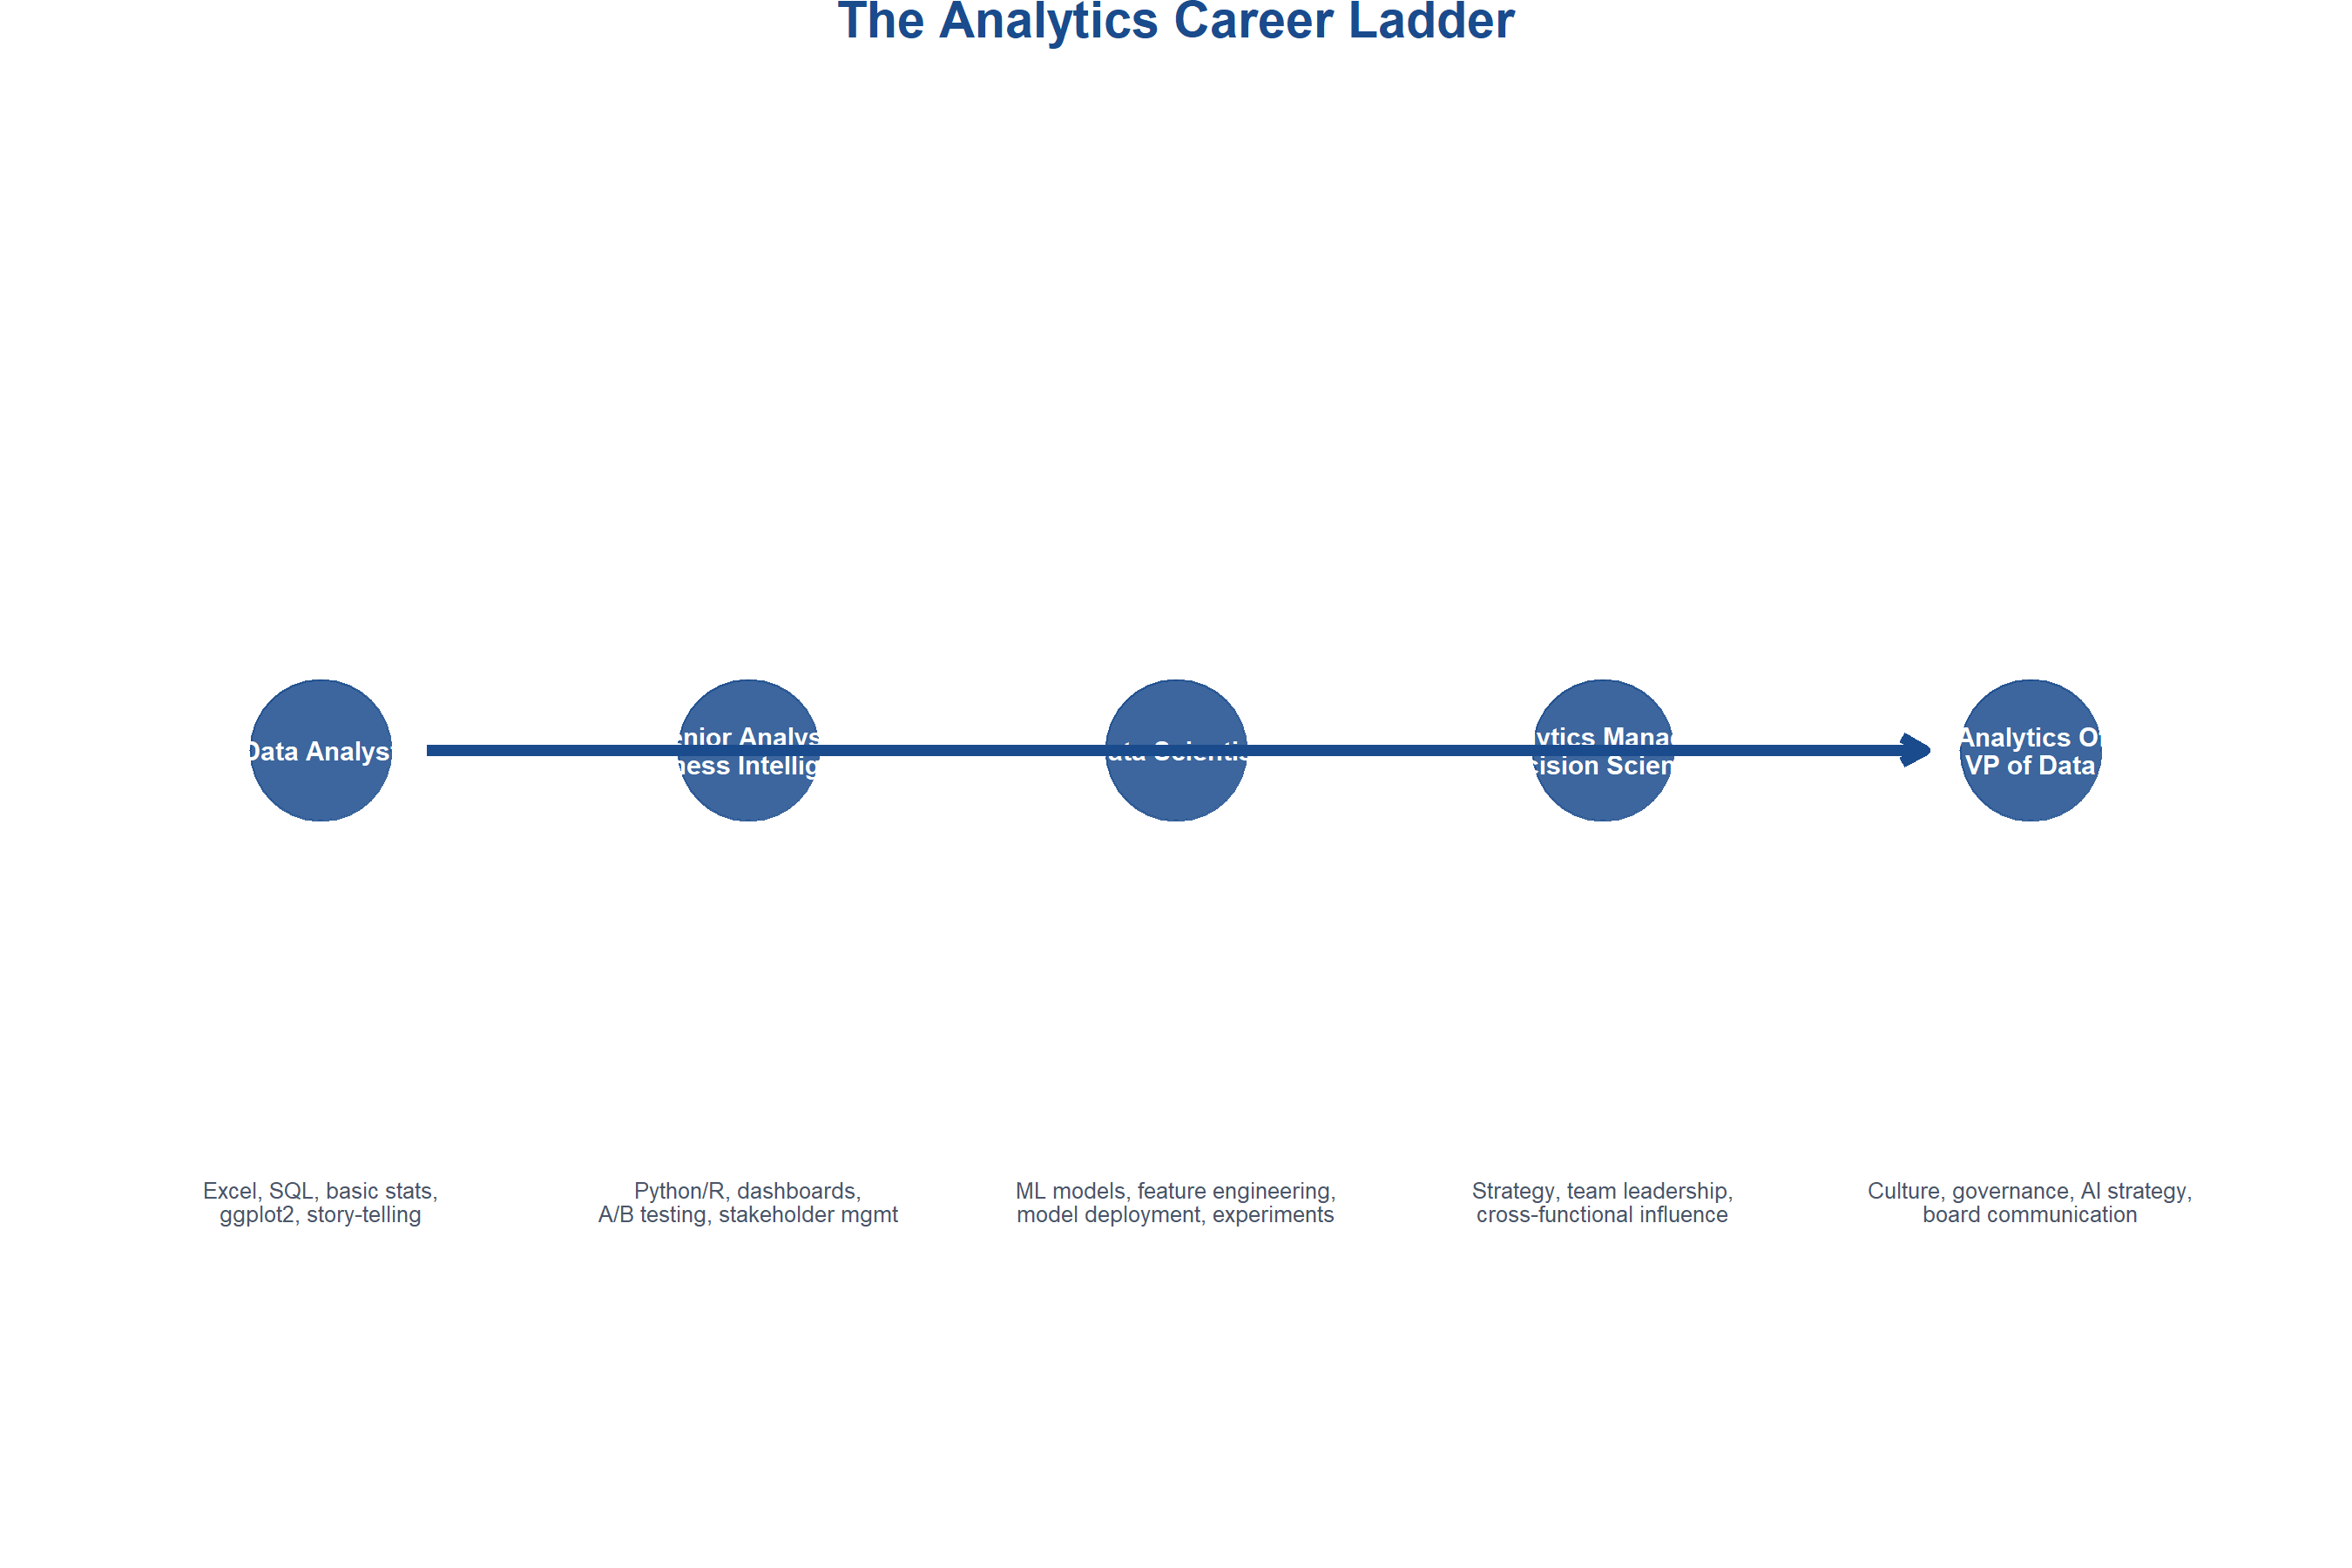
Analytical careers are not linear. The diagram below illustrates the typical growth path, from analyst to decision scientist to analytics leader.
```{r}
#| label: career-ladder
#| eval: true
#| fig-height: 6
library(ggplot2)

roles <- tibble(
  level = 1:5,
  title = c("Data Analyst", "Senior Analyst /\nBusiness Intelligence",
            "Data Scientist", "Analytics Manager /\nDecision Scientist",
            "Chief Analytics Officer /\nVP of Data"),
  skills = c(
    "Excel, SQL, basic stats,\nggplot2, story-telling",
    "Python/R, dashboards,\nA/B testing, stakeholder mgmt",
    "ML models, feature engineering,\nmodel deployment, experiments",
    "Strategy, team leadership,\ncross-functional influence",
    "Culture, governance, AI strategy,\nboard communication"
  ),
  x = c(1, 2, 3, 4, 5)
)

ggplot(roles, aes(x = x, y = 1)) +
  geom_point(size = 18, color = "#1a4b8c", alpha = 0.85) +
  geom_text(aes(label = title), color = "white", fontface = "bold",
            size = 2.5, lineheight = 0.9) +
  geom_segment(aes(x = 1.25, xend = 4.75, y = 1, yend = 1),
               arrow = arrow(type = "open", length = unit(0.25, "cm")),
               color = "#1a4b8c", linewidth = 1.5) +
  annotate("text", x = 1:5, y = 0.88,
           label = roles$skills, size = 2.2, color = "#4a5568",
           hjust = 0.5, lineheight = 0.85) +
  scale_x_continuous(limits = c(0.5, 5.5)) +
  scale_y_continuous(limits = c(0.8, 1.15)) +
  labs(title = "The Analytics Career Ladder") +
  theme_void() +
  theme(plot.title = element_text(hjust = 0.5, face = "bold", size = 14,
                                  color = "#1a4b8c", margin = margin(b = 20)))
```
## Building an Analytics Practice
Whether you are the first data analyst in a small company or joining a large analytics team, the following principles will help you create lasting impact.
### Start with the Business Problem, Not the Technique
The most common mistake made by new analytics professionals is to reach for a sophisticated model before clearly understanding the decision it should inform. Every analysis should begin with two questions:
1. **What decision will change as a result of this analysis?**
2. **What data do we need to make that decision better?**
If you cannot answer the first question, you are not ready to build a model.
### The 80-20 of Value Creation
In practice, 80% of analytical value comes from:
- **Clean, reliable data pipelines** — bad data at the input produces bad decisions at the output
- **Clear, well-designed visualisations** — the best model is useless if no one understands its output
- **Simple models, well-implemented** — a logistic regression with good features often outperforms a deep neural network with poor features
- **Change management** — the model that gets used beats the model that doesn't
The remaining 20% — advanced models, complex architectures, sophisticated simulation — matters enormously in certain contexts (fraud detection, algorithmic trading, medical diagnosis). Know when you are in that 20%.
### The African Analytics Opportunity
Africa's analytical landscape in 2026 presents opportunities that no other region offers:
**Data leapfrogging.** Where Western markets have decades of legacy systems producing structured but siloed data, many African organisations are generating native digital data from the start — mobile money transactions, GPS-tagged logistics, satellite crop monitoring — often in richer, more unified forms.
**Market uniqueness.** Nigerian consumer behaviour, Kenyan agricultural patterns, South African retail dynamics — these require models built on African data. Imported Western models trained on different populations often perform poorly. There is enormous value in building locally relevant analytics.
**Institutional demand.** Central banks, development finance institutions, ECOWAS, the AU — these organisations are making significant investments in data infrastructure and analytical capacity. The demand for skilled practitioners far exceeds supply.
**The LLM advantage.** Large language models can now help analytics teams punch above their weight: generating boilerplate code, explaining statistical output, drafting reports. A two-person analytics team with effective AI tooling can do what previously required a team of ten.
### Building the Right Team
An effective analytics function requires three capabilities:
| Capability | Role | Core Skills |
|:-----------|:-----|:------------|
| **Technical depth** | Data scientists, ML engineers | Python/R, modelling, MLOps |
| **Domain expertise** | Analyst-translators | Industry knowledge, business acumen, data literacy |
| **Communication** | Analytics communicators | Visualisation, storytelling, stakeholder management |
The rarest and most valuable people are those who bridge all three.
## What to Tackle Next
You have built a strong foundation. Here is how to continue:
### In the next 30 days
- Apply one method from this book to a real dataset from your organisation or sector
- Build one dashboard or report that communicates a data-driven insight to a non-technical audience
- Set up a proper R or Python project structure with version control
### In the next 90 days
- Complete one end-to-end project: from raw data to deployed insight (even informally)
- Study the data and analytics landscape specific to your industry (financial services, agriculture, telecoms, healthcare)
- Find a community — analytics meetups, online communities (R Ladies, PyData), or university networks
### In the next year
- Develop deep expertise in one domain (e.g., credit risk analytics, marketing mix modelling, supply chain optimisation)
- Build a portfolio: GitHub, a personal blog, or case studies you can discuss
- Consider formal credentials: the Chartered Institute of Management Accountants (CIMA) data analytics pathway, Google or Microsoft data certifications, or an MSc in Business Analytics
## Final Words
Data analytics is fundamentally an act of translation: turning numbers into narratives, patterns into policy, evidence into decisions. The mathematics and the code are the tools. The judgment — knowing which questions matter, which assumptions to challenge, which trade-offs to accept — that is yours.
Nigeria's economy will double in the next decade. Across ECOWAS and the wider continent, governments, banks, retailers, farmers, and hospitals are making decisions today that will shape the lives of hundreds of millions of people. Many of those decisions are currently made without evidence. Analytics can change that.
The methods in this book are not ends in themselves. They are means to better decisions, more accountable institutions, and ultimately a more prosperous and equitable Africa.
Now go use them.
---
::: {.callout-note}
## A Note on Continuing Education
This book was written in May 2026. The field moves fast. The most important things you can do to stay current:
- Follow the arXiv machine learning pre-print server (arxiv.org/list/cs.LG) for research developments
- Read industry reports from McKinsey, Deloitte, and African-focused think tanks (Afrobarometer, IGC, ACET)
- Engage with the R community (`r-bloggers.com`, `#rstats` on social media) and the Python/ML community (`fast.ai`, `Towards Data Science`)
- Experiment continuously — the best way to learn a new technique is to apply it to a real problem
:::
---